
In today’s economy, understanding the financial landscape of the trucking industry is crucial for business owners who rely on logistics. Truck drivers play a pivotal role in supply chain operations, affecting delivery timelines and costs. This article provides a comprehensive breakdown of how much truck drivers make, touching on average salaries, compensation factors, regional variations, experience levels, and global perspectives. By delving into these chapters, business owners can gain insights into budgeting for trucking services and the implications of driver compensation on overall operational efficiency.
Reading the Road: How Truck Driver Pay Really Comes Together and What It Means for Your Career

Truck drivers occupy a unique space in the economy. They keep supply chains moving, yet pay continues to reflect a mix of miles driven, routes chosen, and the economics of freight demand. The baseline number that often appears in discussions is the weekly earnings figure: about $1,715 per week for truck drivers in the United States, drawn from a large data set that aggregates roughly half a million salaries from job postings over the past three years. That translates to roughly $90,000 a year if you work full time. It’s a useful benchmark, but it’s only a starting point on a longer road of nuance.
The value of averages lies in what they represent, and what they omit. An average like $1,715 a week describes the middle of a wide spread. Some drivers earn more by logging miles on long-haul legs, some earn less when local work or smaller markets define the workweek. The distribution stretches across multiple realities: entry-level drivers who are still building experience, seasoned veterans who specialize in high-demand corridors or hazardous materials, and teams who share the workload to push annual miles higher. A single number cannot capture the texture of these conditions, yet it anchors the conversation about what people can expect when they consider a trucking career.
Regionally, pay can drift in ways that reflect freight demand, cost of living, and local competition among carriers. Coastal corridors often see higher demand for long-haul transport, while interior areas may balance demand with available capacity. Drivers who move between regions for better routes or more consistent work can shift their earnings from one season to the next. Even within the same state, the same truck and the same cargo can deliver different pay because the miles, backhauls, and time at home all influence how compensation stacks up week to week.
Experience matters, too. New drivers typically start with base pay that compensates for training time and the learning curve. As experience accrues, many programs reward drivers with higher per-mile rates, better access to premium lanes, or enhanced opportunities for longer routes that keep them on the road longer and at work more weeks out of the year. Specialized freight—think controlled or hazardous materials, temperature-controlled loads, or oversized cargo—often carries higher pay, because it requires additional credentials, tighter schedules, or more careful handling. And then there is the distinction between local, regional, and long-haul driving. Local routes may offer steadier schedules and predictable time at home but can come with lower mileage pay, whereas long-haul routes rack up more miles and can push annual earnings higher even if the weekly paycheck appears more variable. The story behind the numbers is a story of miles, schedules, and opportunities, not simply a single salary figure.
Beyond the basic pay, there are other elements that shape what a driver earns in practice. Overtime, per-diem arrangements, accessorial pay for things like detention or waiting time, and sometimes sign-on bonuses can shift the bottom line. Benefits such as health insurance, retirement contributions, and paid time off add substantial value that isn’t captured in a weekly wage alone. In markets facing driver shortages, carriers may create more aggressive compensation packages to attract and retain talent, including raises, retention bonuses, or enhanced home-time schedules. It’s important to view pay as a package rather than a one-note figure, because the true value comes from how the entire compensation structure aligns with a driver’s needs and goals.
The numbers also invite a comparative glance toward other markets where the labor market for truck drivers differs in meaningful ways. In a country like Australia, for example, the estimated average hourly wage for truck drivers in Victoria sits around $36.20 AUD. This figure, reported in a regional context, illustrates how the same occupation can carry different wage structures and cost-of-living dynamics. When comparing across borders, it helps to consider currency exchange, tax treatment, social benefits, and the typical work-life balance offered by employers in each region. The contrast emphasizes that “average pay” is not a global monolith but a reflection of local economies, regulations, and industry health.
For someone weighing a trucking career, these data points shape expectations and decisions. It is useful to think of pay as a baseline to gauge opportunity rather than a fixed target to hit every week. A driver who negotiates routes with favorable mileage and consistent schedules, cultivates credentials for high-demand freight, and chooses carriers with transparent pay structures can surpass the most conservative interpretations of the data. The nuance lies not only in the miles logged but also in how the job fits into a wider life plan—home time, family commitments, and personal priorities all interact with pay in meaningful ways.
To connect the concepts to practical steps, consider how best to position yourself in the market. Start by understanding the value of experience and specialization. If you’re early in your career, consider pursuing endorsements that qualify you for premium lanes or specialized freight; those credentials often accompany higher pay, even if the immediate weekly figure is tempered by the learning curve. Over time, map out routes that maximize meaningful miles while offering reasonable home time. The choice between local, regional, and long-haul work is not only about revenue potential; it’s also about stability, schedule predictability, and personal rhythms that sustain motivation and safety on the road.
Investing in equipment and gear that boosts efficiency can influence earnings indirectly as well. A driver who optimizes load planning, minimizes downtime, and reduces mechanical risk can maintain higher utilization of available driving hours. In that context, the value of reliable, well-organized gear becomes a practical extension of the pay discussion. For drivers who are curious about how gear can influence daily operations and profitability, a look at the broader world of truck accessories can be illuminating. See more on truck accessories to understand how practical upgrades can support a steadier, more efficient workflow on the road: truck accessories.
The data, while informative, is best treated as a compass rather than a fixed map. A robust approach to assessing pay involves looking at multiple sources, understanding how pay is calculated in your preferred job type, and recognizing how market dynamics—like driver shortages or regulatory changes—can shift compensation. Carriers may describe pay in terms of per-mile rates, hourly wages, or salary models, and each structure carries different implications for risk, predictability, and total earnings. The important takeaway is not a single figure but a framework for evaluating opportunities, negotiating effectively, and planning a career path that aligns with personal priorities while still capitalizing on the upside of the market when conditions favor higher compensation.
As you evaluate opportunities, it’s helpful to keep the big picture in view. Pay is one dimension of a complex professional life that includes safety, job satisfaction, safety culture, and the sense of purpose that comes from helping goods move efficiently through the supply chain. The weekly paycheck matters, but so do home time, health benefits, retirement security, and the opportunity to advance into supervisory roles, fleet operations, or training. A career in trucking can be personally and financially rewarding, especially for those who treat pay as a function of broader choices—route selection, specialization, and the ongoing investment in skills and equipment.
Source data and further detail about the baseline earnings can be found through a salary data platform that aggregates worker compensation from job postings. This resource provides context for the kinds of pay figures discussed here and helps readers calibrate expectations as they explore opportunities in the industry.
External resource: https://www.indeed.com/salaries/truck-driver-salary
Inside the Paycheck: How Experience, Routes, and Market Demand Shape Truck Drivers’ Wages

A concise overview of truck driver pay: base wages vary by route type, cargo, and region; long-haul work often pays more, but requires more time away from home. Experience, certifications, and reliability typically raise earnings, while owner-operators face different cost structures. Pay is also affected by fleet size, company benefits, and pay models that reward efficiency, safety, and on-time delivery. Understanding the broader compensation package helps prospective drivers see beyond the headline per-week or per-mile rate.
Regional Pay on the Open Road: Understanding Where Truck Drivers Earn More and Why
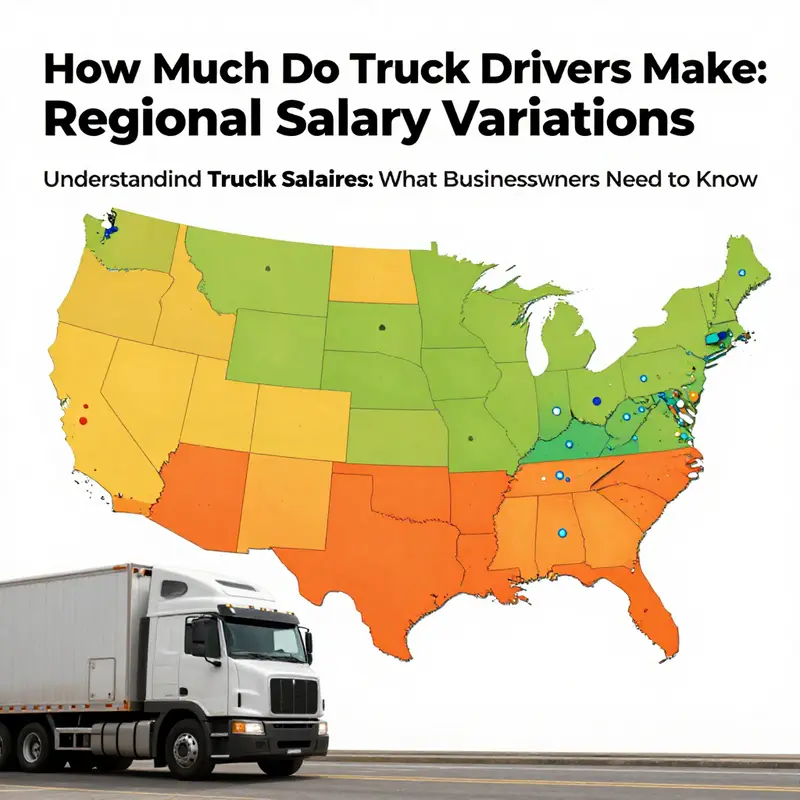
Wages for truck drivers never exist in a single uniform line. They are a tapestry woven from geography, route type, demand, and the regulatory environment that governs how many hours a driver can work and how those hours are compensated. The latest, wide-spread wage data paints a nuanced portrait: a national median for heavy and tractor-trailer drivers around $53,560 per year in 2024, according to the U.S. Bureau of Labor Statistics. Yet another lens—salary aggregations drawn from thousands of job postings—puts a weekly average near $1,715, which translates to roughly $89,000 to $90,000 if worked full-time across a year. Those two figures are not contradictory; they measure different things. The BLS median is a central tendency across all states and job types, while the Indeed average captures what employers commonly post and what drivers actually earn in practice, including variations in overtime, miles, and the pace of work. Taken together, they set the stage for a deeper look at how regional forces shape earnings on the road.
The regional story adds color to that picture. Wages rise and fall with location in a way that reflects cost of living, demand for freight, and the local regulatory climate. In high-cost states such as California and New York, pay tends to exceed the national median. Drivers in these areas often command premium rates to offset the higher costs of housing, insurance, fuel, and general living expenses, as well as the intensified competition for qualified drivers in busy logistics hubs. That said, a higher nominal wage can be offset by taxes and living costs, so the take-home picture may appear different once regional expenses are accounted for. The Bureau of Labor Statistics provides state- and occupation-specific estimates, which helps readers compare apples to apples across regions and track how the market shifts over time. The underlying message is clear: location matters not just for the paycheck, but for the real value that paycheck holds in a given community.
On the other end of the spectrum, lower-cost states may offer wages that run a bit beneath the national median. The driving dynamic here is not uniform, however. Some regions in lower-cost states offer competitive pay to attract drivers amid tight labor markets or to serve corridors with high freight demand. The type of work cuts across this landscape as well: regional routes that keep drivers closer to home versus long-haul routes that accumulate miles and, with them, per-mile pay and potential overtime. The compensation mix can tilt in favor of higher earnings in scenarios where per-mile rates are strong and mileage sits high, even if the base wage appears modest at first glance. Specialized roles—such as hazardous materials transport or routes that require steep regulatory compliance—can push earnings higher regardless of whether the state is among the priciest or more affordable. In those cases, employers layer in premiums for risk and scheduling complexity, so pay rises with the added responsibilities and the need for specialized training.
For job seekers, the implications are practical. A job offer in a high-cost state might promise a higher nominal wage, but the real benefit depends on how the overall compensation package stacks up against living costs and taxes. Conversely, a smaller market might advertise a lower wage yet offer excellent home time and a predictable schedule, which has its own value in terms of quality of life. The best approach is not simply to chase the highest headline number but to evaluate the total compensation: base pay, overtime opportunities, per-mile incentives, bonuses, and benefits such as health coverage, retirement plans, and paid time off. The rhythm of miles and the cadence of days at home are also part of the earning equation. If your focus is raw annual income, you might pursue markets with high freight demand and premium per-mile rates. If work-life balance ranks higher, a market that favors shorter trips and reliable home time can deliver more value than a slightly higher clocked wage elsewhere. The conversation about money thus becomes a dialogue about life on the road as much as life off it.
The data landscape supports this nuanced view. The national median offers a snapshot, but the real story emerges when you drill into state-level estimates and the types of driving that populate those figures. Regulatory frameworks—such as hours-of-service rules—shape how many hours a driver can log and how pay accrues during long trips. Demand cycles in the freight economy, influenced by manufacturing, retail inventories, and seasonal surges, can tilt weekly earnings up or down, sometimes without a corresponding change in the baseline pay rate. For readers seeking actionable, up-to-date information, the Bureau of Labor Statistics maintains an Occupational Employment and Wage Statistics page that breaks down pay by state and occupation. This is the resource that helps readers compare regions with precision and stay current as the market evolves.
As readers weigh these numbers, it helps to keep in mind the broader ecosystem of trucking life. Earnings do not exist in isolation from the work schedule, the miles logged, and the personal choices drivers make about home time and family obligations. For instance, routes that maximize miles may yield higher gross pay due to per-mile rates and overtime, but they often entail longer periods away from home. Those who prioritize being home more often might accept slightly lower gross earnings in exchange for a steadier schedule and reduced separation from loved ones. The decision space widens further when one considers specialized freight. Hazmat loads, overweight or oversized shipments, or long-haul duties can command substantial pay bumps, reflecting the added risk, training requirements, and regulatory compliance involved. In short, regional pay variations interact with personal preferences to shape true earnings and the day-to-day experience of truck driving.
Amid these considerations, it is useful to acknowledge global context without losing sight of the U.S. landscape. Comparable wages in other countries mirror different regulatory frameworks, living costs, and currency values, so direct comparisons must be approached with care. The Australian figure cited in introductory materials—where the average hourly wage for a truck driver in Victoria sits around $36.20 AUD—highlights how regional economies set distinct baselines for pay. The takeaway is not a simple apples-to-apples comparison but an appreciation of how geography, economy, and policy sculpt what a driver earns and what that earnings power buys in daily life.
To ground the discussion in practical, on-the-ground resources, consider how drivers think about gear and the day-to-day realities of trucking life. Equipment and modifications can influence efficiency, safety, and the overall value a driver derives from the job. For example, storage and organizational solutions on a truck can impact route efficiency and job satisfaction. A widely referenced resource covers practical gear options that many drivers find useful for optimizing their rigs: Truck Boxes. This kind of content helps contextualize the lifestyle aspects of trucking alongside the wage data and regional differences discussed above. Truck Boxes provides a tangible sense of how equipment choices intersect with the demands of a career on the road.
Ultimately, regional pay variations are real and meaningful, but they interact with cost of living, taxes, taxes-related net income, and personal priorities. The right region for a driver is not simply the place with the highest annual figure; it is the place where earnings, miles, scheduling, and quality of life align with professional goals and family needs. The numbers are a compass, not a final map, pointing toward markets with strong demand and favorable compensation structures while also highlighting the tradeoffs of long trips, time away, and upfront training requirements. As the trucking labor market continues to evolve—driven by freight demand, regulatory updates, and broader economic conditions—staying attuned to credible data remains essential for anyone charting a course on the open road. External resource: https://www.bls.gov/oes/current/oes_nat.htm
Behind the Numbers: How Experience, Routes, and Roles Define Truck Driver Pay
Pay for truck drivers does not arrive as a single number on a paycheck stub. It is a mosaic built from miles, routes, endorsements, and the structure of the employer’s compensation plan. In the United States, the most recent snapshot from Indeed shows a national average near the low to mid-90s in dollars per year, with December 2025 data placing the figure at about $93,839 annually for full-time drivers. Earlier estimates leaned toward roughly $90,000, especially when weekly earnings are translated into annual pay. Those numbers, while helpful, are a starting point rather than a guarantee. The real picture stretches from just above the median to well into six figures for certain routes and specialties, and it shifts with the economy, fuel costs, and the demand for truck capacity. From the hum of the highway to the cadence of freight markets, earnings respond to a web of shifting factors that drivers learn to read as they gain experience.
Experience level matters a lot. Entry-level drivers typically earn less than the benchmark. A common range is $50,000 to $60,000 per year, and this is mostly a function of starting pay scales, training programs, and the speed with which a new driver can build a safe driving record. As drivers accumulate time behind the wheel, maintain clean safety records, and demonstrate reliability, their earnings grow. Long-haul drivers often see a steeper climb because the job demands extended time away from home and a higher level of responsibility. For those who pursue specialized endorsements on top of their CDL—such as hazardous materials, tanker, or combination endorsements—the pay premium can push total compensation beyond six figures on a consistent basis, especially when overtime and performance bonuses are included. The trajectory is not automatic, but the path is clear: more miles, more endorsements, and a reputation for dependable performance tend to translate into higher earnings over time.
Job type shapes not just the pay, but the rhythm of the life that comes with it. Over-the-road (OTR) drivers typically earn more per trip or per mile because they contribute to the freight backbone that keeps supply chains moving across long distances. But the trade-off is time away from family and a schedule that can be unpredictable. Regional and dedicated routes can offer steadier schedules and solid pay, often with shorter home time but a more predictable workflow. Then there are specialized roles: reefers, which carry temperature-sensitive goods; flatbeds, which require more skill to secure nonstandard loads; and hazmat transport, which demands additional training, compliance, and risk management. Those options tend to carry higher pay, especially when employers factor in bonuses for meeting safety metrics, miles driven, or on-time delivery records. It is not unusual for experienced, end-to-end drivers in high-demand specialties to surpass $100,000 per year in total compensation, especially when combined with shift differentials and annual performance bonuses. These figures, of course, vary by region and market conditions, but they illustrate how the right combination of route, skill, and employer can lift earnings well above the baseline.
Beyond base pay, compensation packages often include elements that widen the gap between a starting salary and eventual earnings. Bonuses tied to safety records, on-time performance, or fuel efficiency can add a meaningful lift. Shift differentials reward night or weekend work, and some employers offer overtime pay that significantly increases take-home pay for drivers who log extra hours. Benefits packages—health insurance, retirement plans, paid time off, and sometimes tuition reimbursement or company-paid certifications—contribute to the value of a job even if the base rate remains modest. In practice, a driver might see a mix of guaranteed wage, per-mile or per-hour earnings, and performance-based incentives. Large logistics firms and government-contracting outfits often maintain more sophisticated pay structures, sometimes with built-in ladders for advancement into lead driver roles, fleet management positions, or training roles that carry additional compensation. The net effect is that two drivers with the same base rate can end the year with noticeably different take-home pay once all these extras are accounted for.
Geography and market dynamics can tilt the pay scale in subtle but meaningful ways. In the U.S., pay tends to be higher in regions with greater demand for long-haul capacity, and metropolitan areas or hubs with many logistics employers can push up mileage rates and bonuses. Conversely, markets with a surplus of drivers and intense competition may tamp down wages, especially for new entrants. For context, the earlier global snapshot in the original research included the-scale contrasts: while the U.S. average hovers in the low to mid-$90k range, the example of a different country reflects a very different pay framework, such as hourly wages in Australia, where a truck driver might earn in the $36.20 per hour neighborhood, with cost-of-living and local job types affecting the final annual figure. Those cross-country contrasts underscore that “how much” a truck driver makes is as much about local job architecture as it is about miles logged. In practice, this means a driver moving from a rural area with sparse freight to a busy logistics corridor can see their pay rise even if the same miles are driven, simply due to higher demand and the presence of more premium routes.
With that in mind, many prospective drivers gauge their path by the type of work they find appealing and the compensation structure that accompanies it. A new driver may start with a company that offers a higher base rate for training, plus sign-on bonuses and a ramp-up schedule. Others pursue companies with strong long-term mileage programs and robust benefits, trading some upfront pay for more predictable routes, better home time, and clearer advancement opportunities. The choice may hinge on personal goals as much as on the dollar figure. For someone who values family time, a regional route with good pay and consistent home days might be preferable to an all-out OTR position with higher pay but no home time consistency. For someone drawn to speed, independence, and the challenge of hauling unusual loads, a flatbed or hazmat role can be a gateway to higher earnings, provided one is willing to invest in the necessary endorsements and safety training. The evolving landscape also means drivers who actively pursue ongoing education—whether through reputable training programs or company-sponsored certifications—often unlock faster paths to higher pay tiers, supervisory roles, or specialized driving assignments. In short, the path to higher earnings is often a function of intentional career design as much as pure miles.
From a consumer perspective, the take-away is that the headline figure alone hides a spectrum of possibilities. The pay story is shaped by miles, cargo type, time away from home, and the alignment between a driver’s preferences and a hiring company’s needs. If someone is weighing a future in trucking, it can pay to map out a few scenarios: a pure OTR track with generous per-mile rates, a regional plan with a mid-tier base and strong bonuses, or a specialized niche that demands extra training and compliance discipline. The data suggest that the most lucrative paths combine experience, a stable pipeline of miles, and the right endorsements, but even within that framework, the difference between a mid-$50k start and a six-figure finish is often the result of choices made early on—whether to invest in endorsements, to chase high-demand routes, or to accept the incentives that a particular employer uses to retain skilled drivers. For someone planning a long-term career, it can also help to compare not just pay, but total compensation—bonus streams, retirement contributions, health benefits, and opportunities for advancement that can compound over a decade.
Within the broader arc of the trucking industry, earnings reflect broader economic currents, including labor supply and demand, fuel costs, and regulatory changes. The numbers provide guidance, but they do not tell the whole story about day-to-day work, safety, and job satisfaction. Paying attention to how a job is structured—the schedule, the home time, the load types, and the potential for career progression—offers a clearer view of lifetime earnings than any single annual figure. As the chapter on resources demonstrates, there are multiple pathways to higher pay, and the right fit depends on a driver’s priorities and skills. Those considering a step into the field might begin by examining pay scales by experience level and by the main job types, then weighing how the companionship of a stable home life might affect long-term earnings and wellbeing. For a practical sense of how gear and logistics support a high-mileage lifestyle, consider the truck boxes guide as a reference point truck boxes. The next chapter will explore how time commitments, truck maintenance costs, and operational overhead influence a driver’s real take-home after miles and taxes. For ongoing validation of pay trends, readers can consult external salary benchmarks and keep an eye on evolving market data, which often shift with the ebb and flow of freight demand. As always, the best approach is to anchor expectations in a careful analysis of route mix, endorsements, and the specific pay structure offered by prospective employers. External resources provide a compass, but the map is drawn by the driver’s choices and the lanes they decide to run.
External reference: For an up-to-date, official breakdown of truck driver pay, see Indeed’s salary page.
Miles, Markets, and Paychecks: A Global Window on Truck Driver Earnings
Pay for truck drivers is not a single number but a spectrum drawn across borders, industries, and road conditions. The most immediate takeaway from the research landscape is that compensation is as much about the route as it is about skill. In the United States, the latest cross-posting data from Indeed shows an average weekly figure around $1,715, based on more than half a million salaries posted in the last three years. That translates to roughly $90,000 a year for full-time work, a robust starting point by many measures but not the ceiling in a field shaped by mileage, timing, and load specifics. When you widen the lens, you see a different story painted by the U.S. Bureau of Labor Statistics: a median annual wage of about $50,000 in 2024. The two statistics don’t cancel each other out so much as illuminate how compensation varies with career stage, geography, and the kinds of freight that a driver is trusted to move. The median tells you where the middle ground sits; the Indeed data hint at a marketplace where pay can cluster well above or far below that point depending on the employer, the equipment, and the demands of the job. And then there are those who push beyond the median into six-figure territory. Experienced drivers or those working for specialized carriers can earn substantially more, with credible reports surfacing of annual earnings crossing the $100,000 threshold. This is not the typical path for every driver, but it exists in pockets where tonnage, time away from home, or hazardous-material endorsements tilt the economics in a driver’s favor. The lesson for anyone weighing the profession is not to fixate on a single figure, but to understand the matrix of factors that can lift or limit earnings over a career.
Across the globe, the pattern holds in broad strokes while diverging in the details. In Canada, typical earnings span roughly CAD 60,000 to CAD 80,000 per year, with regional variation and specialization playing decisive roles. The European landscape presents a similar structure but expressed in euros and tempered by combinations of wage levels and benefits that reflect social models in places like Germany and the Netherlands. Here, annual pay commonly lands in the €45,000 to €60,000 range, but the real value comes from a package that includes robust benefits, reasonable work-life balance, and the capacity to command premium routes or shifts when needed. In Australia, the numbers tilt higher, with average salaries around AUD 75,000 to AUD 90,000 per year. The elevated figure reflects a mix of long-haul demand, stricter safety and training standards, and market friction that makes reliable, cross-country trucking a valued skill. In each context, the core drivers of pay are familiar: the country’s wage framework, the scarcity or abundance of qualified drivers, the type of freight, and the employer’s appetite for risk and reliability.
Yet the numbers tell only part of the story. Pay is not a fixed annual sum that a driver pockets regardless of how the year unfolds. It is often built from multiple streams: base pay, per-mile rates, or hourly wages; overtime and detention time; bonuses tied to efficiency, safety, or on-time delivery; and sometimes profit-sharing arrangements for owner-operators who shoulder more business risk. The structure matters as much as the headline figure. In a system where per-mile or per-load rates prevail, a driver can see meaningful volatility from week to week, driven by freight demand, fuel prices, and the length of hauls. Overtime and weekend premiums, when available, can smooth the peaks and valleys, converting what might look like a flat salary into a more dynamic earnings trajectory. In markets where end-to-end delivery time is tightly scheduled, bonuses for meeting windows or for fuel efficiency can become a meaningful portion of annual income, sometimes transforming what looks like a modest base into a more competitive total take-home.
These patterns also reflect the broader labor market realities that shape truck-driver compensation. A driver shortage in many countries bolsters bargaining power for experienced professionals, particularly those who can handle hazardous materials, operate specialized equipment, or manage long-haul routes that demand extended time away from home. The attractiveness of a route—whether it’s steady regional runs or high-mileage cross-country journeys—often correlates with a driver’s compensation story. In markets where liveable schedules and predictable rest breaks are part of the standard package, the perceived value of the job increases, even if the base rate remains within a given band. Conversely, regions that emphasize flexibility or the capacity to handle volatile freight flows may reward those who can adapt quickly with higher pay or better incentives.
There’s also the question of how much a driver’s earnings reflect skill versus circumstance. A few drivers command high incomes not because the base rate is extraordinary, but because their work integrates multiple revenue channels. They may assume ownership of a fleet, negotiate better terms for specialized loads, or align with carriers that offer sign-on bonuses, guaranteed hours, or maintenance stipends. Some of the strongest earning stories emerge from niche markets—hazardous materials, oversize loads, or dedicated contracts that require a driver to stay on the road longer than a typical schedule. While these paths are not universally available and can entail greater risk or time away from home, they illustrate how compensation can outpace the typical narrative for those who plan, negotiate, and execute with a strategic mindset.
What does all this mean for someone weighing a trucking career today? First, it means framing pay in the context of the specific lane you expect to run. A regional driver in one country may earn more on a weekly basis than a cross-border long-haul driver in another, and the difference often reflects not only the rate of pay but the density of available work, the schedule, and the cost of living in the region. It also means recognizing that the figure you see in a posting or in a study is seldom the whole story. The best decisions come from understanding how the job’s earned income is assembled—base pay, overtime, bonuses, and the value of benefits like health coverage, retirement plans, paid time off, and other perks that accompany the pay.
For those curious about the practical impact of gear and operational choices on earnings, there is a simple angle to consider. Equipment and load-planning capabilities can affect a driver’s efficiency, which in turn can influence pay through bonuses or higher pay-per-mile in some contracts. The way a truck is equipped, what kind of securement systems are used, and the ability to optimize routes for fewer delays can tighten the gap between a modest and a robust annual income. This isn’t marketing language for a gimmick—it’s a reminder that the day-to-day realities of trucking intersect with compensation in tangible ways. For drivers who want to explore how gear can support earnings in a meaningful way, the broader catalog of truck accessories offers a practical window into optimizing loads and routes. In this context, see how investments in practical gear—like improved storage, better load management options, and smart organizational tools—can affect your efficiency and, by extension, your bottom line. For a quick reference on related gear and equipment, many readers find resources focused on truck accessories useful as background: truck accessories.
The global snapshot also invites reflection on living costs and regional standards of living. A pay figure is more valuable when weighed against housing, healthcare, and transportation costs in a given country or city. What appears lucrative on paper can be less so in practice if the local price level eats away a large share of take-home pay. Conversely, a lower base wage in a country with a lower cost of living can yield an attractive standard of living for a driver who prioritizes travel, time at home, or the ability to stretch earnings over a longer horizon. This dynamic underscores why drivers often speak of compensation in terms of a bundle rather than a single line item—a bundle that includes stability, predictable time off, the quality of rest, and the reliability of the equipment that carries their work.
The emerging trends section of the research points to an important caveat: anecdotes about extraordinary earnings can circulate online and skew perceptions. A viral TikTok video from August 2025 that highlighted a driver earning over $350,000 a year demonstrates what is possible in highly advantageous scenarios—such as specific contractual arrangements, marquee routes, or masterful optimization strategies—but it does not rewrite the baseline economics that apply to most drivers. It does, however, stress a critical point: the landscape of truck-driver compensation is not static. It responds to demand, regulations, and the evolving needs of shippers and carriers. For many current and prospective drivers, the focus should be on building the right mix of skills, routes, and benefits that align with their personal goals and the realities of their region. This means looking beyond the headline numbers to the real-world conditions that determine whether a given pay scale supports the life a driver wants to build.
To ground these observations in authoritative data, the U.S. Bureau of Labor Statistics’ Occupational Outlook Handbook remains a foundational reference for the profession. It provides an official portrait of the occupation’s pay, duties, and projected demand, alongside regional variations and structural factors shaping the field. For readers who want to verify the baseline figures or explore the underlying methodology, consult the BLS page on Heavy and Tractor-Trailer Truck Drivers. In the broader global context, the chapter’s numbers reflect a composite of national wage structures and market dynamics rather than a single universal standard. The learning here is not just about “how much” but about “how and why” compensation evolves as a function of role, region, and the strategic choices a driver makes across a career.
In sum, the question of “how much do truck drivers make?” cannot be answered with a single figure or a one-size-fits-all metric. The pay landscape is a mosaic shaped by location, experience, freight type, and the particular compensation package a carrier offers. Within the United States, a median wage around $50,000 in 2024 sits alongside higher potential for experienced or specialized drivers who can reach six figures. Across the Atlantic and into the Pacific, Canada, Europe, and Australia present their own patterns—each with its own costs, benefits, and career incentives. The most meaningful takeaway is to view earnings as a composite signal: base pay, variable pay, and the value of the rest and resources that support long-term, sustainable work on the road. The figures, trends, and scenarios outlined here aim to equip readers with a framework for evaluating opportunities, negotiating thoughtfully, and charting a path that aligns with personal and professional goals.
External resource for further reading: https://www.bls.gov/ooh/transportation/heavy-and-tractor-trailer-truck-drivers.htm
Final thoughts
Understanding how much truck drivers make is essential for business owners involved in logistics and transportation. This knowledge not only aids in budgeting but contributes to making informed decisions about hiring and retention strategies in a competitive market. By recognizing the factors that influence compensation and the regional salary variations, business owners can appreciate the value that truck drivers bring to their operations. In a landscape where logistics is vital to success, effectively managing driver compensation ensures smoother operations and satisfied clients.